
“… little by little Hänsel dropped all the crumbs onto the path. The woman took them deeper into the woods than they had ever been in their whole lifetime.
… Hänsel comforted Gretel and said, ‘Wait, when the moon comes up I will be able to see the crumbs of bread that I scattered, and they will show us the way back home.’
When the moon appeared they got up, but they could not find any crumbs, for the many thousands of birds that fly about in the woods and in the fields had pecked them up.
Hänsel said to Gretel, ‘We will find our way,’ but they did not find it. …”
The Brothers Grimm published the fairy tale of Hänsel and Gretel over 200 years ago. This well known cautionary tale contains a number of worthwhile life lessons:
- Nobody gets to choose who they are related to.
- A duty of care owed is meaningless unless honoured or enforced.
- Always understand a person’s motives before accepting their help. What is in it for them?
- Wait until you have actually won before celebrating! Overconfidence leads to a fall.
- Poorly protected valuables make easy targets for sticky-fingered thieves.
- Only lazy authors resolve plot holes by introducing new characters at the very end of stories!
However Hänsel’s plan to chart his progress through the deep dark woods using a trail of breadcrumbs was as unrealistic and poorly thought through as a great many financial plans!
If it wasn’t for the implausible last-minute appearance of a benevolent giant talking duck, Hänsel’s piss poor planning and wishful thinking would have undoubtedly ruined them both.
Following the trail of breadcrumbs
Personal Finance aficionados drop their own trail of breadcrumbs by diligently tracking their spending and net worth.
Hearing the tale these numbers have to tell potentially leads towards knowledge and understanding.
- Does their approach actually work?
- Are their actions aligned with their goals?
- Will it lead towards the accomplishment of those goals?
- How does that performance stack up against that reported by others?
- What are those others doing more/better/different?
- What can we learn from past performance? Where can we do more of what works, and less of what doesn’t?
Failing to listen to those numbers, and critically assessing the tale they tell, leads the breadcrumb follower astray.
They end up like Hänsel and Gretel wandering aimlessly through the woods, lost, and fervently hoping for a miraculous rescue.
So what are the common things I see Personal Finance bloggers doing, that are almost exactly wrong, when presenting their periodic progress reports?
Starting in the wrong place
Many blogger income statements start with their net salary. This is the amount that actually hits their bank accounts each pay day.
The problem with this approach is that it completely ignores taxation expenses and pension contributions.
Taxes are not something that should be blindly accepted, they can be effectively managed and minimised, just like any other expense.
Pensions are one of the few legal tax avoidance measures remaining.
Contributions to pensions are savings, and as such should be included in your savings rate calculations. Just because you can’t access them until you are old and grey doesn’t mean they should be ignored or forgotten about!
Consider the following scenario:
- An employer budgets an amount of money to hire an employee to perform a given role.
- The cost to the employer is constant across the two scenarios.
- The employee’s preferred combination of salary and benefit can significantly alter how much they actually receive from that budgeted amount.
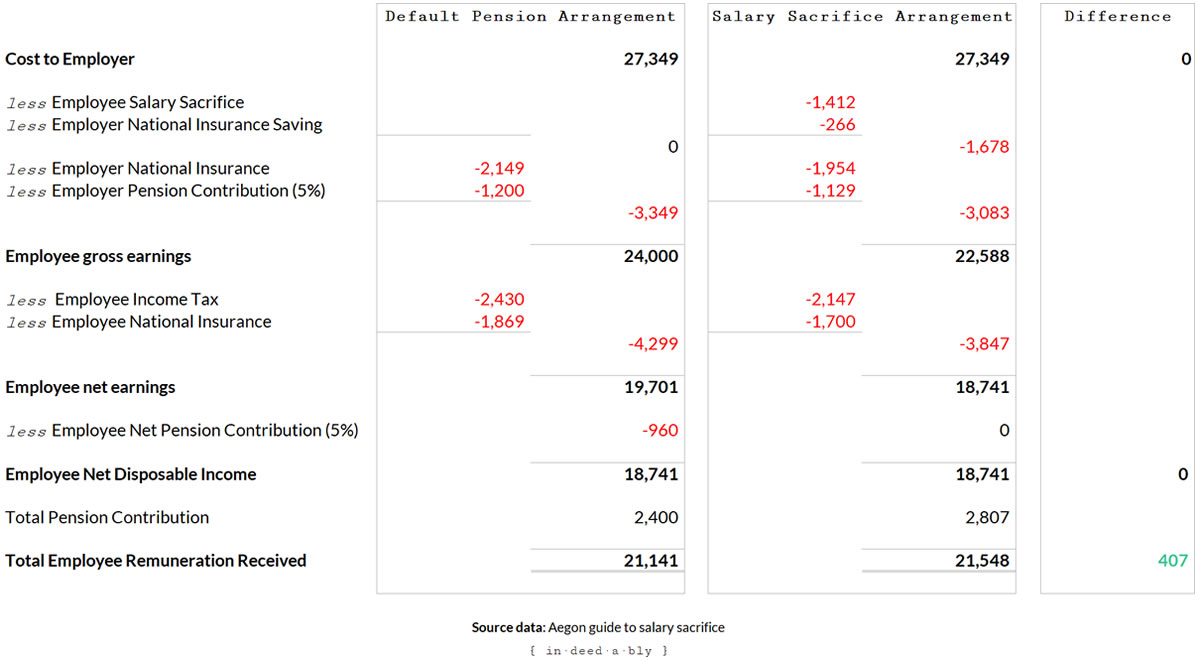
Salary sacrifice worked example.
In this example the employee could receive exactly the same amount in their bank account on pay day.
Yet they retain an additional 1.5% of the employer’s budget by opting to salary sacrifice part of their salary into their pension.
Which option would you choose?
If you weren’t monitoring your before-tax income, you would probably have never have considered there may be a choice!
Taking a filtered view
Another danger with starting your monitoring from the point where you pay hits your bank account is that you are unlikely to pay close attention to your pension.
It is easy to focus on the tangible, putting off worrying about an inaccessible tax-deferred pot of money that must remain locked away until some arbitrary age defined by government regulation.
Except here is the thing. The money locked away in that age restricted pension is yours.
You have already done the work to earn it, and someday you will (probably) be in a position to benefit from it.
It may prove to be the difference between your surviving on people food rather than cat food in your dotage!
Pensions often have multiple layers, with investors being stung with fees and charges at each and every one of them.
- Platform fees.
- Brokerage fees.
- Entrance fees.
- Management fees.
- Holding fees.
- Exit fees.
- Transfer fees
- Drawdown fees.
A real-life illustration of how expensive pension arrangements can be, consider the restrictive pension option that staff were forced to participate in at an investment bank I once worked for.
At the time of my escape, I had the princely sum of £312 invested.
Today that investment is worth just £250!
During that time period the markets (which the pension was invested in) enjoyed the two longest bull markets in history, while the S&P500 index has effectively doubled in value.
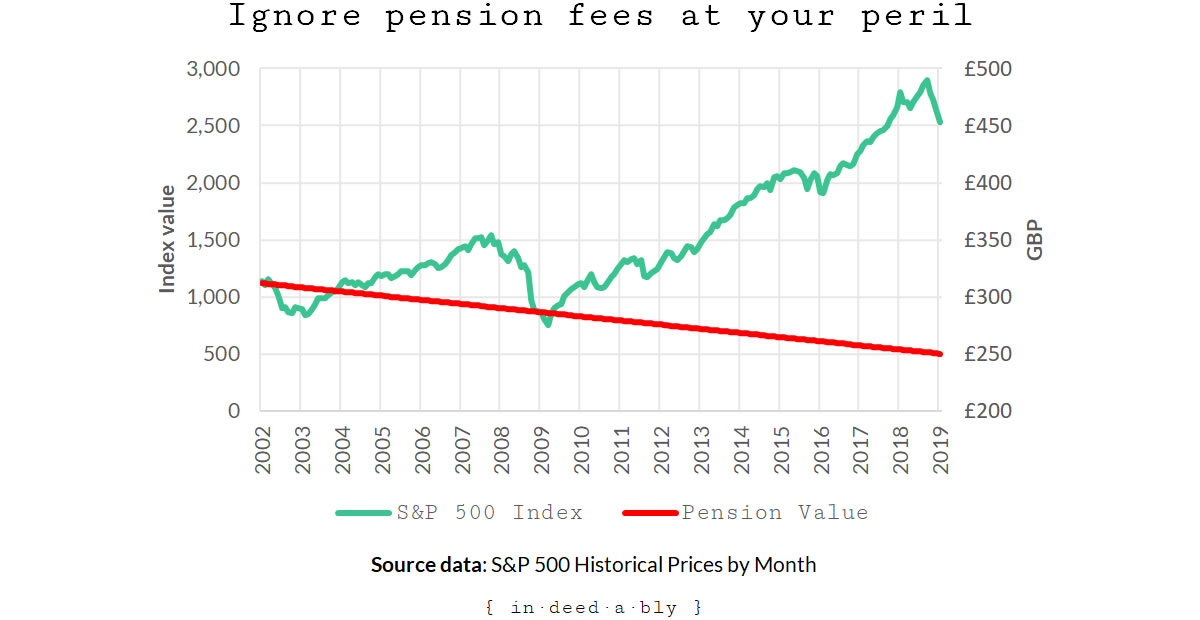
Piss poor pension performance.
I keep the fund as a reminder to myself to always pay attention.
Total cost of ownership.
Opportunity cost.
Value for money.
The rumours that the service charges and exit fees incurred by moving this money, would exhaust the remaining capital are (only slightly) exaggerated!
The less attention you pay, the more likely it is that your pension holdings are being steadily eroded by high fees and poor investment performance.
Take your blinkers off!
Include your pension holdings in your net worth calculations.
Factor the pension and investment fees you are being charged into your cash flow monitoring and savings rate calculations.
If you aren’t monitoring them there, where are they being monitored?
Ignoring inflation
One of my favourite Financial Independence charts is maintained by RetirementInvestingToday. It does a masterful job at telling the story of RIT’s financial journey at a glance. The chart below shamelessly copies RIT’s concept using some made up data.
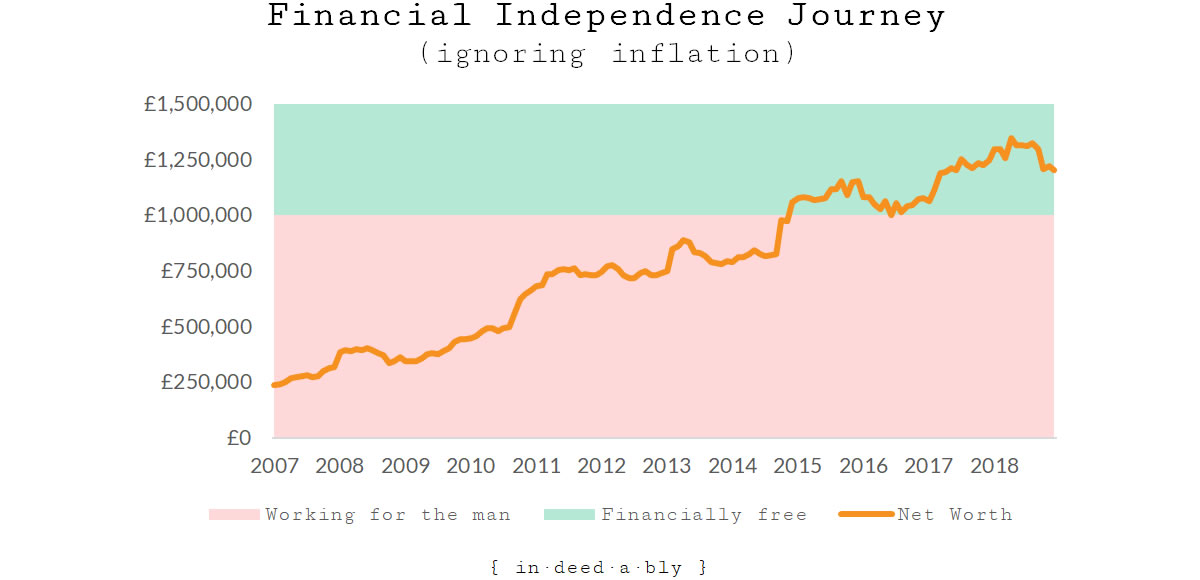
Financial Independence while ignoring inflation.
Imagine if I had arbitrarily copied RIT’s Financial Independence number of £1,000,000, but then failed to adjust it for inflation.
As prices rose over time, the purchasing power of that nominal million pounds would fall.
The quality of my post Financial Independence target lifestyle would be steadily declining as a result of my not adjusting my goal post to reflect this reality.
Now consider that same chart with the Financial Independence number being adjusted to maintain a constant purchasing power.
Today I would require more than £1,375,000 to match the purchasing power of £1,000,000 at the beginning of 2007. To simplify the illustration I have applied the inflation over that period linearly.
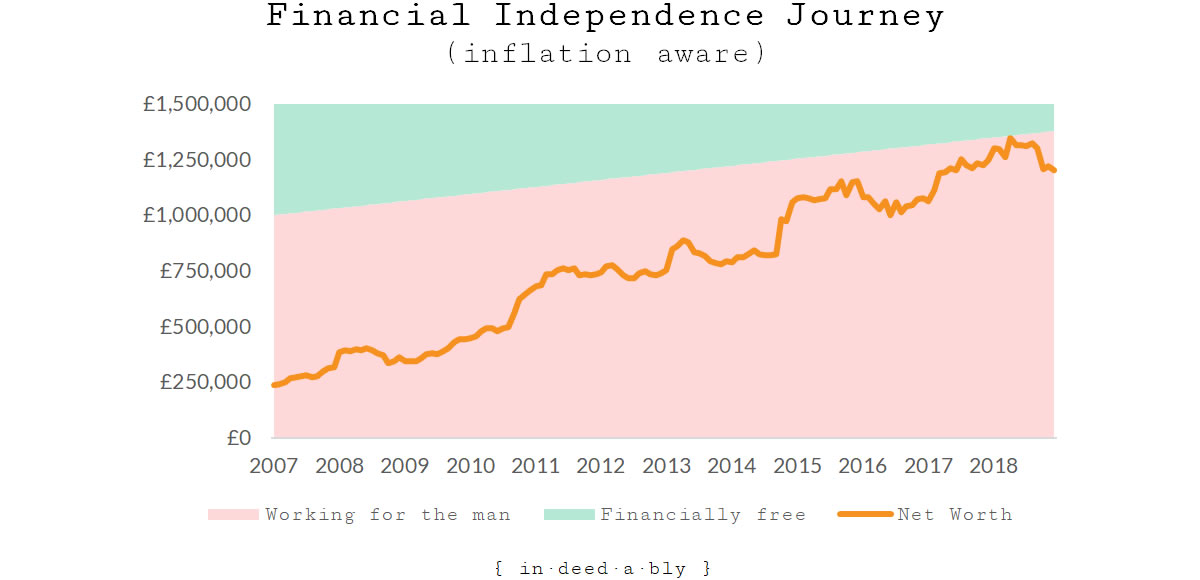
Financial Independence while acknowledging inflation.
Inflation certainly changes the story!
Previously I would have blissfully believed myself to be Financially Independent, with all the control of time freedom and victory dances that may entail.
Now suddenly I’m not financially independent, and my direction of travel is firmly heading the wrong way! Cue the five-alarm toddler tantrum.
Conflating investing with performance
How often do you see Personal Finance bloggers giving themselves a high five about the amount that their investment pot has grown? Hardly an exotic claim or rare occurrence!
“My portfolio increased in value by £15,000 this year. Yay for me!”
Now ask yourself how often you see a breakdown of how much of that growth was due to investment performance, and how much was actually the result of additional capital being deployed?
“Wait a second, I contributed an extra £20,000 this year to my ISA. So that means I… oh bollocks, I’ve actually lost £5,000!”
Unitising your investment holdings is an effective way of separating investment capital contributions from investment performance.
Conceptually unitising is similar to the way people bet on a roulette wheel. The height of their stack of chips represents the amount of capital they have invested. The number they place those chips onto represents the price of the investment.

Unitise your investments. Image credit: whekevi.
Invest more money? Additional chips are placed on the stack, the price remains unchanged.
Investment price falls? The stack moves from the higher priced square to a lower priced square, while the height of the stack remains the same.
In this way the two aspects of your investment are tracked independently of one another.
As an added bonus, unitising makes it relatively straightforward to compare investment performance across holdings, or even between asset classes!
Monevator has a great post detailing the mechanics of unitisation. It does so without making any allusions about the stock market resembling a game of chance!
Exchanging genius for luck
Since the Brexit referendum, internationally diversified investors using British Pounds as their home currency have enjoyed very flattering investment results.
Unfortunately much of this outcome is the result of the Pound falling in value against other currencies, rather than any particular investing genius on behalf of the individual investor.
The chart below demonstrates the amount of foreign currency an identical holiday would have cost in each of 2016 and 2018. You need a lot more Pounds to pay for things than a couple of years ago!
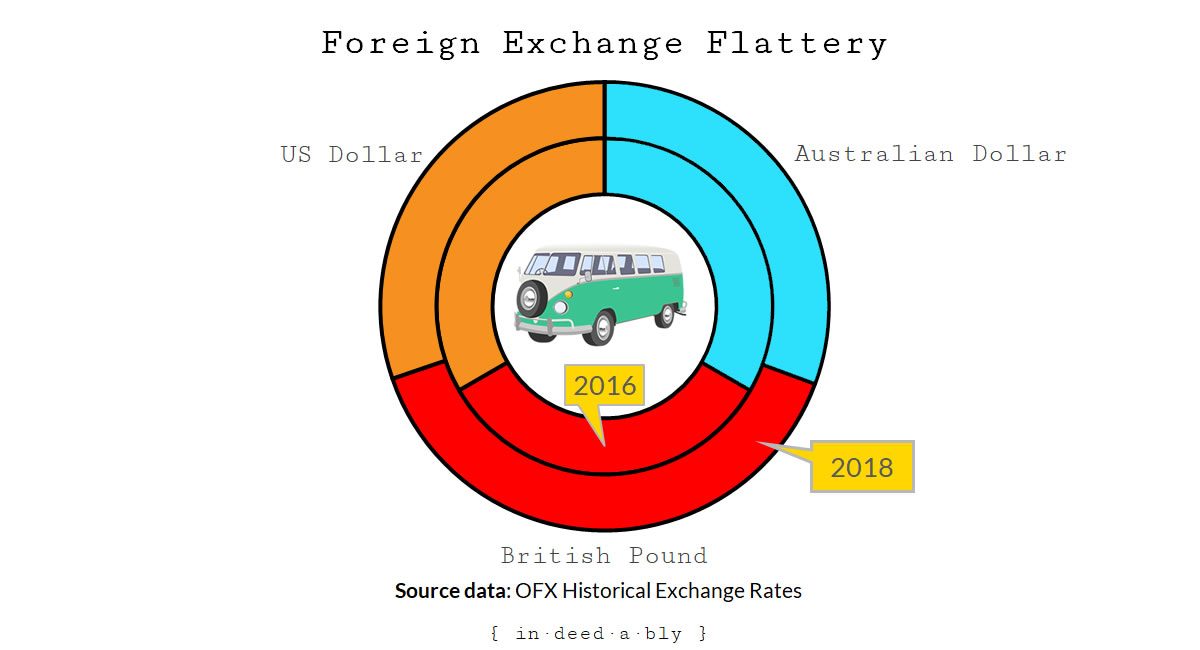
Foreign exchange rates influence investment returns. Image credit: Clker-Free-Vector-Images.
Therefore to determine whether the investment returns you are experiencing are in spite of your best efforts, or because of them, it is important to understand the impact of foreign exchange movements.
FIRE v London’s monthly scorekeeping does a good job accounting for foreign exchange movements between the currencies he invests in.
This provides a degree of investing self-awareness that many lack, which in turn helps make him a better investor.
Siloed thinking
The chances are pretty good that you have investment holdings scattered across a multitude of accounts. Pensions, ISAs, taxable brokerage accounts, peer-to-peer lending, property, banks, and so on.
Yet many bloggers examine their risk exposure, target weightings, and asset allocations within a silo.
They should be evaluating them across their whole investment portfolio.

How do you evaluate exposure? Within silos or portfolio wide? Image credit: Lego.
Your pension account and your taxable account may operate over different time horizons, but collectively they are both exposed to risks including regulatory, legislative, political, currency, market, sector, and individual firm.
The exposure to your home market and currency is almost certainly greater than you realise.
Exposure to an asset class like property is also likely to be higher than you expect:
- Your home and investment properties are part of that asset class.
- So too your REIT holdings, and also their share of your index trackers.
- How many of those peer-to-peer loans were for property development projects?
Does your target weighting reflect your existing exposure reality?
It should.
Almost exactly wrong
Applying these approaches to the periodic assessment of your net worth and savings rate won’t guarantee success.
However they will remove a large degree of wishful thinking, self-delusion, and misguided ostrich impersonations that result in many Personal Finance enthusiasts tracking their finances almost exactly wrong.
Adopting these suggestions is akin to replacing your fragile trail of breadcrumbs with a more reliable trail of shiny stones.
If you are going to go to the effort of laying the trail, then you owe it to yourself to ensure that it provides a reliable path to follow.
Following the stones brought Hänsel and Gretel safely home unaided.
Following the breadcrumbs relied upon the miraculous last-minute appearance of a giant talking duck.
You don’t see those every day!

You don’t see this every day. Image credit: travel oriented.
References
- Aegon (2018), ‘For employers: your guide to salary sacrifice‘
- Bank of England (2019), ‘Inflation calculator‘
- CPI Inflation Calculator (2019), ‘UK Inflation Rate, £1,000,000 in 2007 to 2019‘
- FIRE v London (2019), ‘December returns and 2018 review‘
- Grimm, J. and Grimm, W. (1810), ‘Hänsel und Grethel’, Kinder- und Hausmärchen [Translated by Ashliman, D. (2000)]
- Monevator (2015), ‘How to unitize your portfolio‘
- OFX (2019), ‘Historical Exchange Rates‘
- RetirementInvestingToday (2018), ‘The RetirementInvestingToday journey to Financial Independence‘
- University of Pittsburgh (2011), ‘Hansel and Gretel‘
Featured by


FIRE v London 8 January 2019
Great post, and thanks for the reference.
I must confess I don’t know enough about roulette for your chips analogy but I do know unitisation and think you have taught me something about roulette!
I don’t mind others saying “yay I’m up £15k”, which is real enough if they have an absolute target to hit. What does get my goat is when they say “I’m up 5%” without breaking out how much came from contributions versus price changes.
This being said I only just realised that in effect fees I pay are withdrawals, but not treated as such in my unitisation calculations. So my quoted returns are actually a bit low due to the trading commissions, stamp duty etc that I pay so I’m not blameless here either.
{in·deed·a·bly} 8 January 2019 — Post author
Thanks for your kind words FvL.
We’re all on a learning journey, refining our approach and correcting past mistakes as we discover them. Your transaction costs example is a good one, as without treating them as withdrawals property would have a huge performance anchor compared to other asset classes, given the high stamp duty and conveyancing costs.
youngfiguy 8 January 2019
Apologies if I’m missing something but are fees like withdrawals? I’ve always seen (and incorporated) them as something akin to negative interest. So in effect these reduce your returns.
The point about property transaction costs is an important one. It’s easy to forget the very large costs in transacting (which can in aggregate work out to be well over 10pc of value).
{in·deed·a·bly} 8 January 2019 — Post author
Thanks Mr YFG.
Conceptually the unitised performance of an individual investment is judged by the capital growth and/or income stream(s) that holding generates.
You may choose to hold your investment in a tax free ISA, while mine may reside in a taxable brokerage account. The performance of the investment itself would be identical, in terms of gross yield and capital growth, yet your wiser tax arrangements leave you with more money in your pocket than me.
It is a similar story for the choice of broker platform, and resulting fees.
The point is that the money consumed by fees and taxes is gone, drained by vampiric tax authorities or snaffled by sticky fingered stockbrokers for example. However that event wasn’t the result of the investment itself suffering a loss, but rather your management of that investment.
Nick @ TotalBalance.blog 8 January 2019
Now why did you have to go and do that? You’re such a party pooper 😛
I think it’s fair to “turn a blind eye” to inflation (and investment fees?) when you’re a beginner. I know I do 😉 I’m well aware of inflation and its impact. Which is why I have a fondness for rental properties, as they are considered “inflation safe” investments (at least where I come from).
Now all I have to do is go get me some (rentals that is…).
{in·deed·a·bly} 8 January 2019 — Post author
Apologies if I’ve spoiled your day Nick.
If it is any consolation, when done by the textbook, those “safe” withdrawal rate FIRE approaches are inflation aware. To illustrate:
Personally I have my doubts about that approach, but to each their own.
Of course that doesn’t take into account any lifestyle inflation, so if a LeanFIRE follower tires of living in a cardboard box under a bridge then they are stuffed!
As for fees… much like my younger son deciding it was time for breakfast at 4am this morning, unfortunately pretending they don’t exist does not make them go away.
To make up for pissing in your Cheerios, here is a short funny video of what it felt like to be me this morning:
Caveman 9 January 2019
You are, of course, right in this indeedably. It is far too easy to think that you are doing well or badly when the starting point it all wrong.
What your post also illustrates is why people don’t do this. There are multiple factors to consider and some of them are judgments/decisions rather than there being an absolute standard of what is the correct way to approach it.
Your point with your near negative pension pot also resonated with me. I have a pension from my first job. It’s the smallest of my three pots but it’s still a five figure sum. I have to confess that I have no idea what its invested in and, possibly worse, I have no idea what the charges are that I’m paying on it…I think I may go and dig it out…!
{in·deed·a·bly} 9 January 2019 — Post author
Thanks for sharing your thoughts Caveman, and good luck with that rogue pension.
I agree that there are any number of ways to track your finances and keep score. Every blogger’s monthly/annual reporting posts use different formats and metrics.
Turning a blind eye to facts of life like inflation, aggregate exposure, fees, or taxes is certainly a risky approach. It is one thing to do so out of ignorance, but quite another were we to consciously choose to bury our heads in the sand.
To each their own of course, but only so long as they own the outcomes too!
weenie 10 January 2019
My employer doesn’t offer salary sacrifice and their pension contribution is statutory minimum so nothing to write home about. However, I do check my DC pension balance every month and yes, when I joined, I checked where my funds would be invested and the fees etc. It’s a basic cheap global tracker and it’s run at low cost by L&G so can’t complain. When I leave, I’ll transfer it to one of my SIPPs.
I have to say that I don’t think I’ve really factored inflation into my numbers, which I guess I should. However I haven’t factored inflation into my projections for the state pension or my DB pension either, so perhaps there’s a cancellation of sorts there. And yes, I consistently just look at my net salary and base my savings rate on it, it’s just easier that way, although you could argue, not completely accurate.
I use unitisation (Monevator’s method) to keep track of my investments – thus far it’s been easy as I’ve just been buying/adding. I think things get tricky once I start selling but by then, I might just abandon the tracking as I’ll be spending, not accumulating.
I’m no investing genius, I know that most of my gains are from adding new capital but I still enjoy the odd ‘yay for me’ celebrations! 🙂
{in·deed·a·bly} 11 January 2019 — Post author
Thanks weenie. It is great to hear you have some low fee options available within your work pension.
The inflation question is an interesting one.
Whatever your preferences, it is a factor to consider and make your own decisions about.
Definitely celebrate the small wins, they come about far more often than the big ones!
weenie 11 January 2019
I’m chasing a static FI number, but plan on living off some of the cash flow generated by my investment portfolio. I will not be following any SWR as I don’t intend to preserve my wealth. The annual amount that I’ve planned to live off in the future far exceeds what I spend now but perhaps I should just do the inflation ramp up projection to get a more accurate number. I need to review my plan at some point soon anyway, so this is a timely reminder, thanks!
Frogdancer Jones 19 January 2019
*sigh*
I can point to the accuracy of that currency graph. I came to the UK and Europe for a 9 week holiday back in 2015. Each pound I spent was worth around $2AUS. That hurt…
{in·deed·a·bly} 19 January 2019 — Post author
Thanks Frogdancer Jones.
On the plus side, back in the day that same foreign exchange calculation allowed a generation of savvy Australian backpackers to come to the UK, do their two year working holiday, then return home with enough pounds saved to pay cash for a house (or some of a house, depending on where in Oz they were from!).
Of course most of them didn’t; preferring to invest their money in beer, music festival tickets, and plenty of great fun low cost travel.
The Rhino 1 February 2019
I like what you’ve done with RITs chart there – thats very intuitive, I hope he’s seen it!
Problem is that although that’s a step in the right direction in as much as an FI threshold with a gradient is closer to reality than a horizontal threshold – it’s still wrong.
That’s because macro-level nationwide inflation data bears no resemblance to micro-level individual inflation data.
What you should probably do to get closer to a ‘real-world’ model is use a rolling average of your own historical expense data. Even that won’t be great as the variance in expenses, even when measured over years, is large. A rolling average (over multiple years) should hep a little..
So its still not accurate (in as much as measuring a personal rate of inflation is pretty much impossible), but its better than your CPI/RPI gradient which in turn is better than a flat-line.
{in·deed·a·bly} 1 February 2019 — Post author
Thanks for that astute observation Rhino. Ultimately all projections of this type are figments of our imagination, designed to reassure us that we’re doing the right thing. A more personalised the projection would indeed (probably) result in a closer reflection of what might happen.
For what it is worth, I do my own keeping score based on a moving average.
When it comes projections and forecasts, it has been my experience that life has a way of happening regardless of my best laid plans and spreadsheets! I’ve opted to build in a bit more padding to smooth out the ride, then for the most part not worry too much about it. Probably not as scientific, but remains a sufficiently reassuring fiction I tell myself.