The kitchen was filled with the mouthwatering smells of freshly baked bread and cinnamon.
The oven beeped, and as if by magic my two kids instantly appeared.
I donned a dubious looking Santa Claus oven glove (best not to ask where you insert your hand), and extracted the hot tray of freshly baked cinnamon rolls.
Great British Bakeoff this was not!
My rolls looked like they were the result of a late night drinking game played by Dali and Picasso. That said, pretty or ugly they would taste just the same!
As I set the tray down to cool, the doorbell rang. The boys were due to be picked up for a playdate at any minute, so my cunning plan had been to give them a cinnamon roll each and pack them off while I enjoyed the peace, quiet, and the remainder of my freshly baked delicacies.
I opened the door, nearly getting trampled by my younger son as he bolted past my legs.
“Bye Dad!”
Hot on his heels was his older brother, who dropped his shoulder like a rugby player and charged past me with something wrapped in aluminium foil tucked under his arm. What the…?
“It’s not what you make, but what you keep!” he called victoriously as he jumped into the waiting car.
I waved farewell and returned to the kitchen, greeted by a now empty baking tray and the lingering smell of freshly baked cinnamon rolls.
Bastards!
“It’s not what you make, but what you keep!”
What you keep
Having eliminated my preferred option of sitting around eating cake all day, my thieving offspring inspired to look into the second half of that equation: what you keep.
A little while ago I delved into the Office of National Statistics’ household disposable income figures to figure out whether it would be possible for anyone to achieve Financial Independence.
It wasn’t.
Today I’m using 2016 figures, because that is the most recent period for which the ONS wealth survey data is available.
In 2016 the median equivalised household disposable income was £26,400. The majority of people spent most of that on household expenditures.
The chart below breaks down those household incomes and expenditures by income decile group.
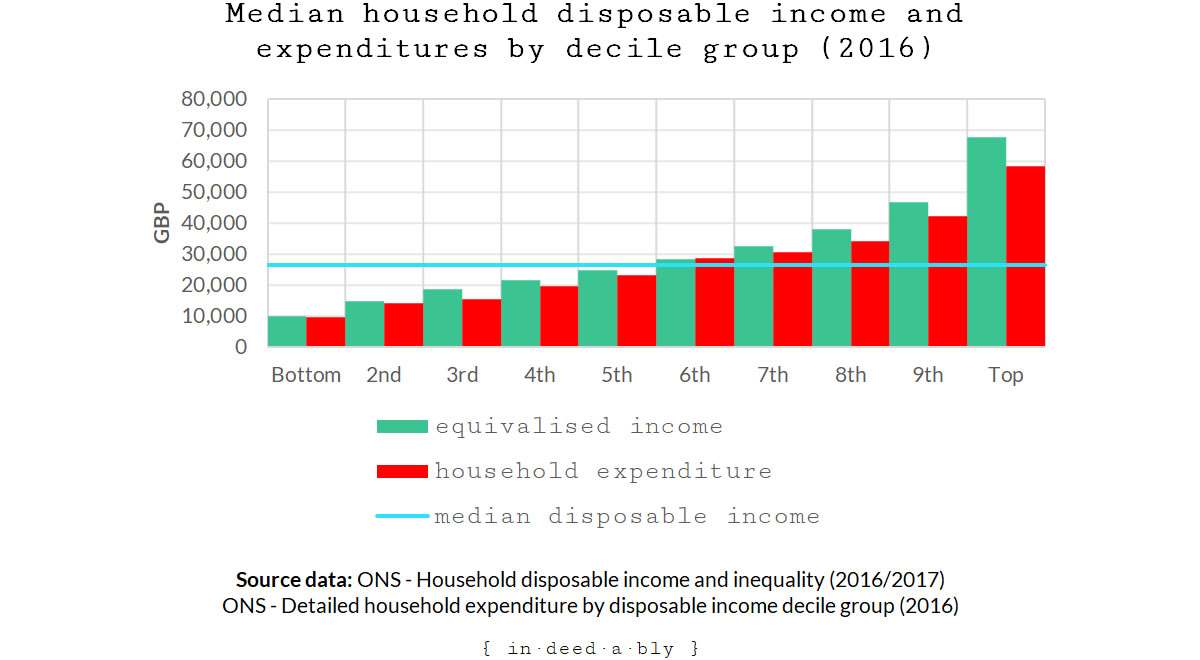
Things look pretty bleak at the bottom end of the earnings spectrum!
It is only the top three decile groups have much margin for error, offering some support for the theory that lifestyle expands with income.
Absolute numbers are interesting, but how do these figures translate into savings rates?
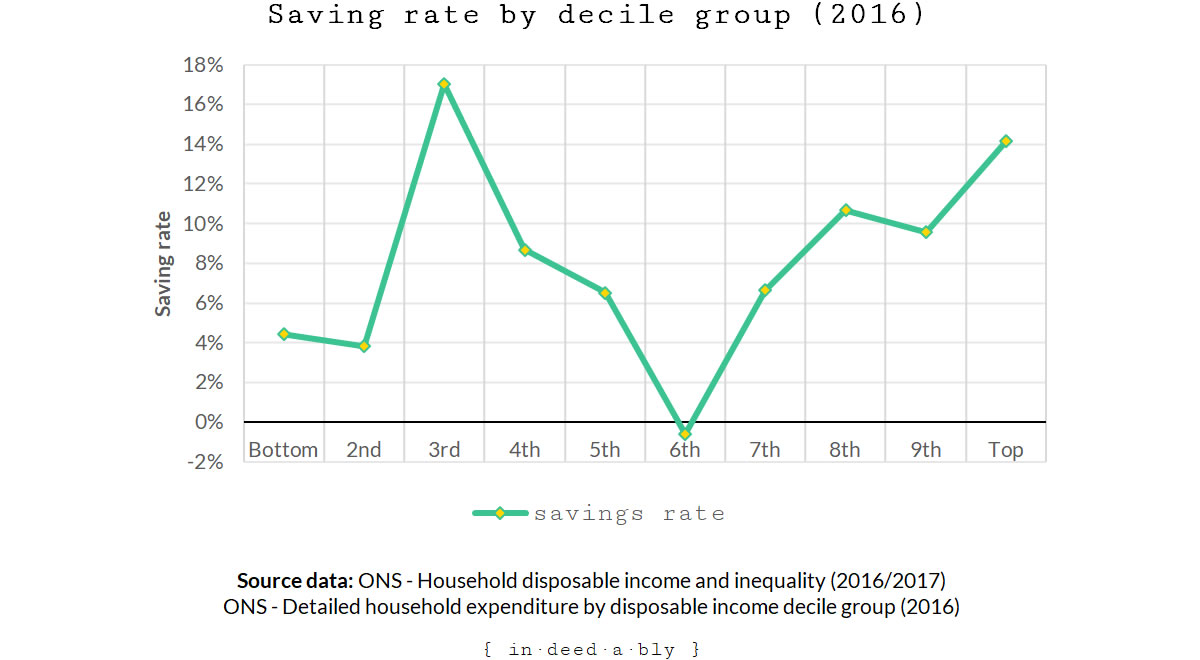
For the purposes of this savings rate chart, I have calculated savings rates as:
(equivalised disposable income – household expenditures) / equivalised disposable income
One of my pet peeves about calculating savings rates this way is it implicitly concedes that taxes aren’t a manageable expense. Much like my younger son demanding breakfast at stupid o’clock on a weekend morning, pretending they don’t exist does not make them go away! Given taxes are one of the largest expense categories for many people, this is a dangerous assumption to make.
Unfortunately we can only work within the limitations of the available data.
As noted last time, the third decile seem to be the most conservative with their money. This appears to be the point at which it starts to become possible to lead more than a simple hand-to-mouth existence.
Conversely the sixth decile spend more than they earn, particularly on lifestyle and entertainment activities.
So far we’ve looked at where the money comes from and where it goes. What happens to the rest of it?
What have people kept?
The median household total wealth in 2016 was £259,400. That was nearly 10 times the median household disposable income.
By way of comparison, that total worth was more than the average house price in England at the time.
On the face of it those median figures tell a nice story, however when I dug into the detail it wasn’t all rainbows and unicorns.
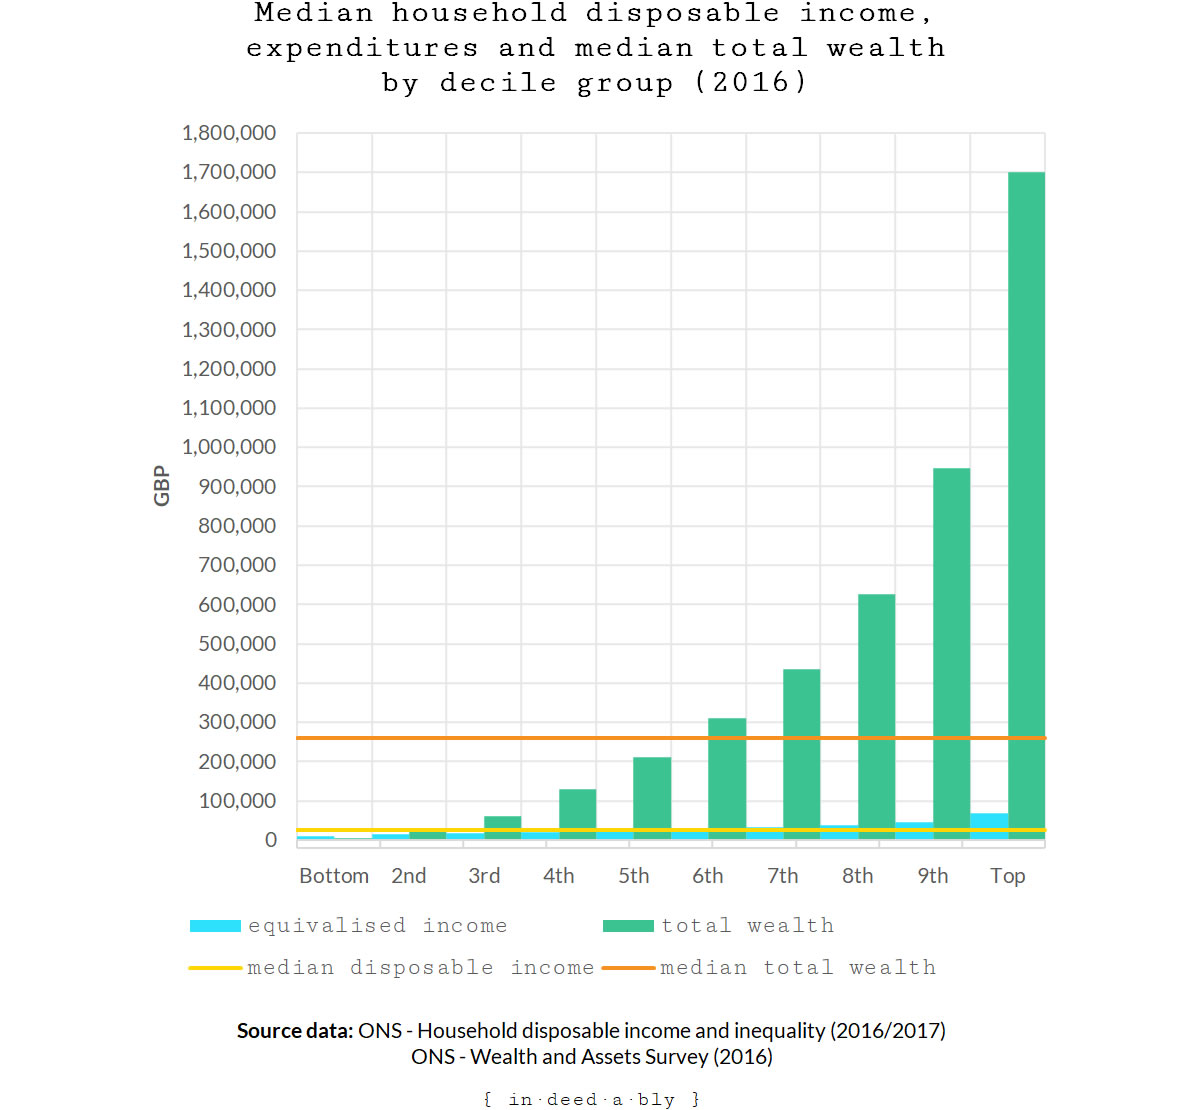
The bottom income decile earn more in a year than they possess in wealth.
Think about that for a second. They are just one small misstep away from financial oblivion. That is a scary prospect indeed!
Things are a little better for the second and third deciles. Their total worth exceeds their disposable income, but not by much. Still some insulation is better than none at all, so it is a step in the right direction.
Next I viewed those total wealth figures through a FIRE movement lens. How many years worth of expenditure does each deciles total wealth cover?
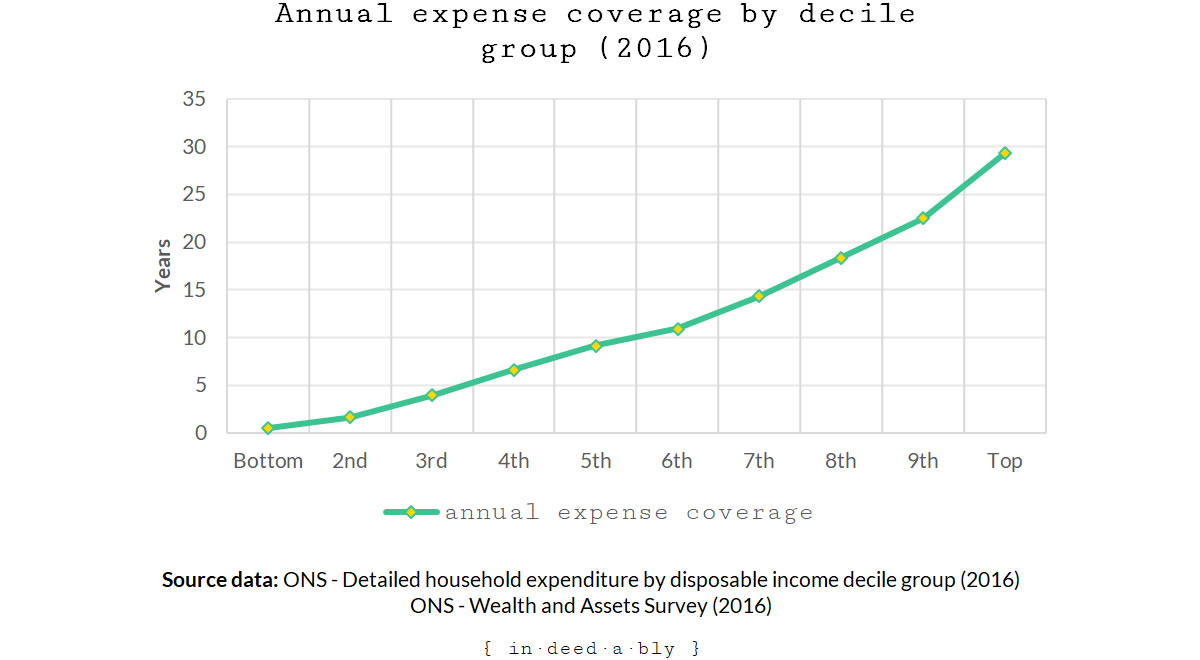
It turns out only to top decile met William Bengen’s 4% “safe” withdrawal rate criteria of wealth exceeding 25 times their household expenditures.
Under Bengen’s theory, based on past US market performance those top decile folks should be able to sustain a 30-year retirement before they run out of money… assuming nothing happens in the future that is markedly different from what occurred in the past.
Asset allocation by income
I was curious how asset allocation varied across the income decile groups.
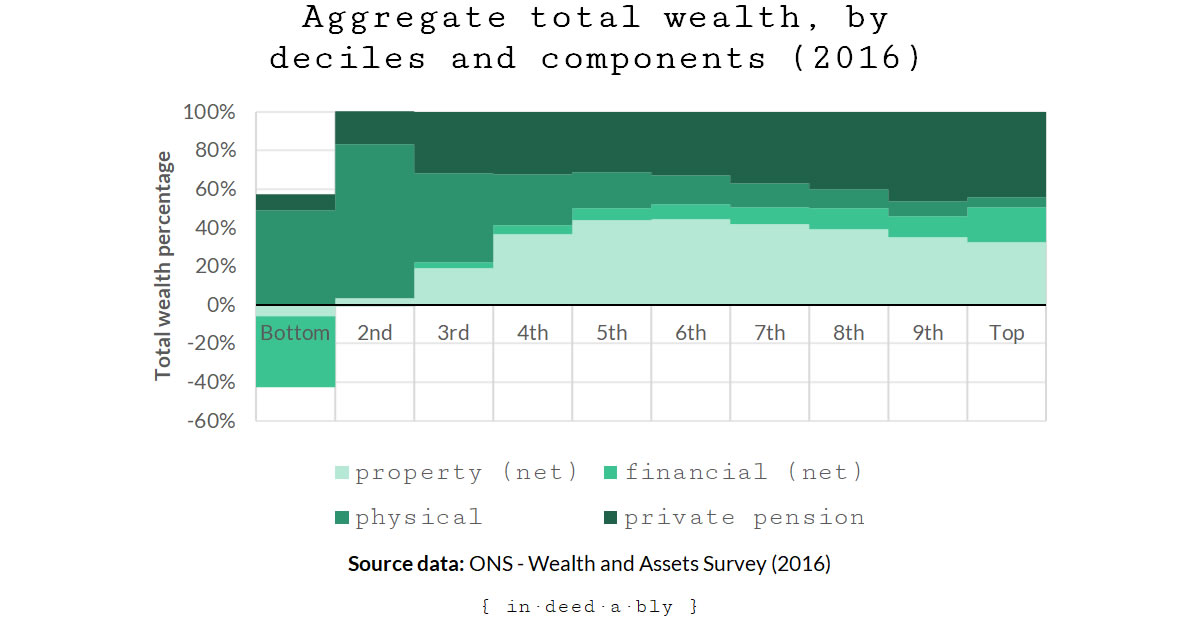
The news wasn’t good for the bottom decile, who are carrying significant financial and property debt. When combined with the grim earnings picture above, these folks are certainly doing it tough.
Physical wealth (i.e. “stuff” like furniture, cars, jewellery, etc) accounted for the bulk of the lower deciles total wealth. That proportion reduced as total wealth increased. This didn’t surprise me, as despite advertisers trying to convince us otherwise, there are only so many televisions and fridges a household might need!
The reverse of this trend was apparent for private pension wealth, generally accounting for an increasingly large portion of household wealth as income increased.
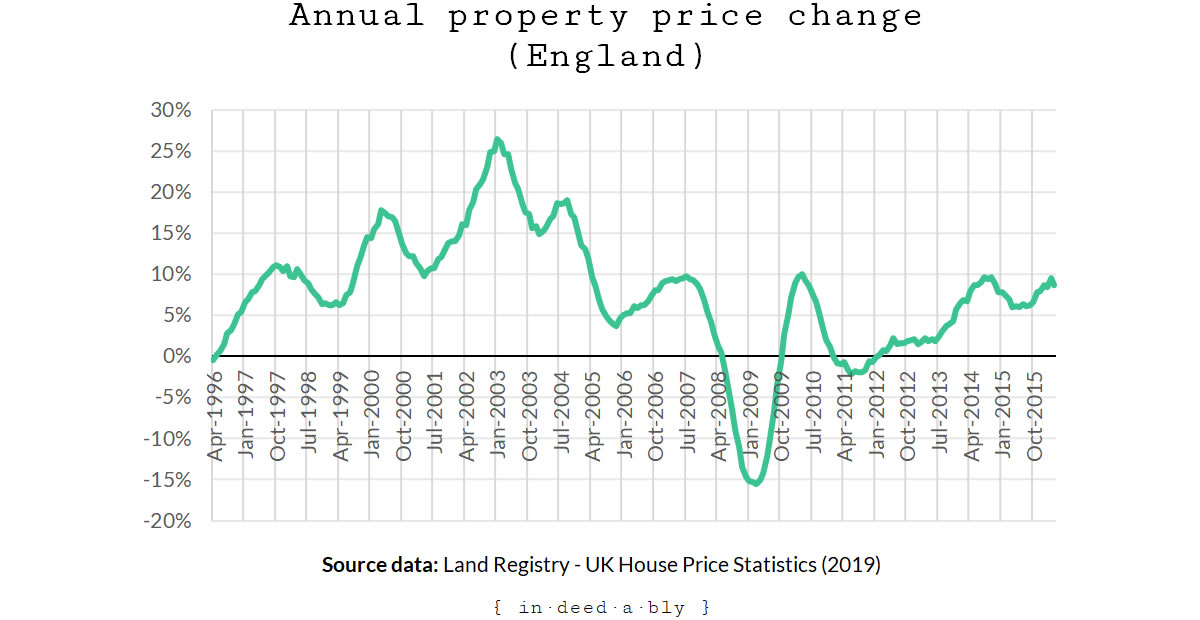
The power of property
The property wealth portion told an interesting story.
This increased steadily before topping out in those “keeping up with the Joneses” fifth and sixth deciles. It then tapers off as income increases, with financial wealth accounting for the bulk of the difference.
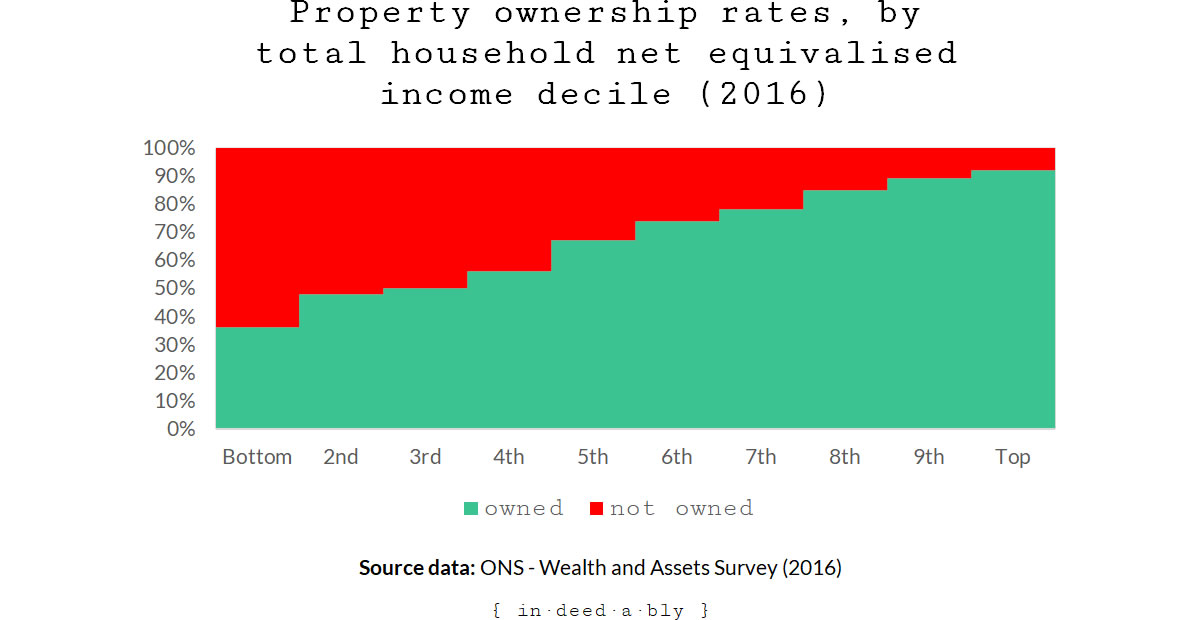
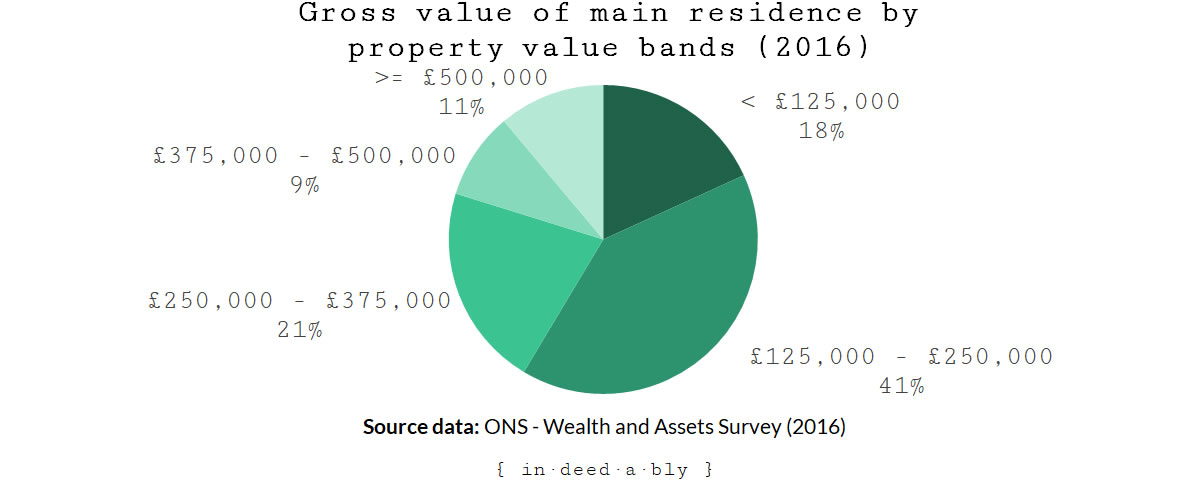
It turns out approximately 66% of households in the United Kingdom owned their principal place of residence.
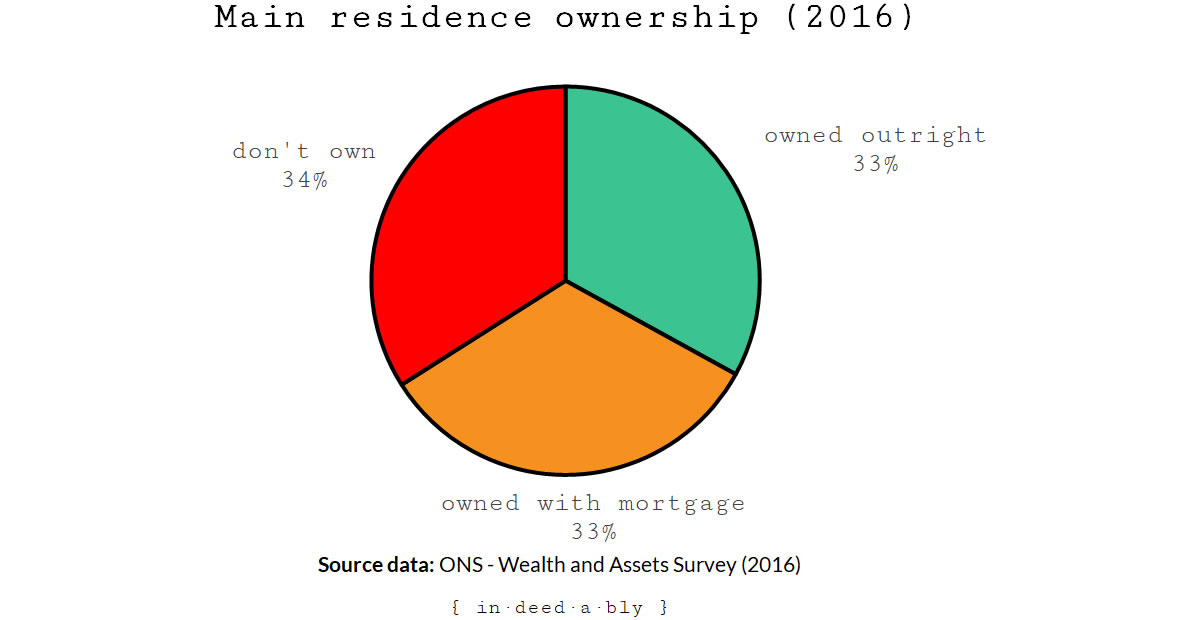
That ownership rate steadily increased with household disposable income.
The majority of those owner-occupied primary residences were worth no more than £250,000, less than the median property price in 2016.
I was surprised to discover that only 5% of households owned buy-to-let properties. I suspect this number understates things a bit, as it has become more common to hold investment properties within a limited company wrapper, so that financing costs can still be offset against rental income.
The low rate of buy-to-let ownership does partially explain the ritual flogging of private landlords the Chancellor performs at budget time. It plays well to the general public (who don’t own buy-to-lets), yet actually impacts a small, and relatively affluent, portion of the electorate!
Inaccessibility increases wealth?
Pensions and home ownership account for a large portion of total wealth, yet this wealth is largely inaccessible if a person is below pension eligibility age and wishes to continue living in their own home.
Does a relative degree of inaccessibility promote wealth growth? After all, if you can’t get at it then you can’t spend it!
To perform a rough evaluation of what portion of accessible total wealth each decile has ready access to I combined pensions and property into an “inaccessible” group, leaving physical and financial wealth as an “accessible” group.
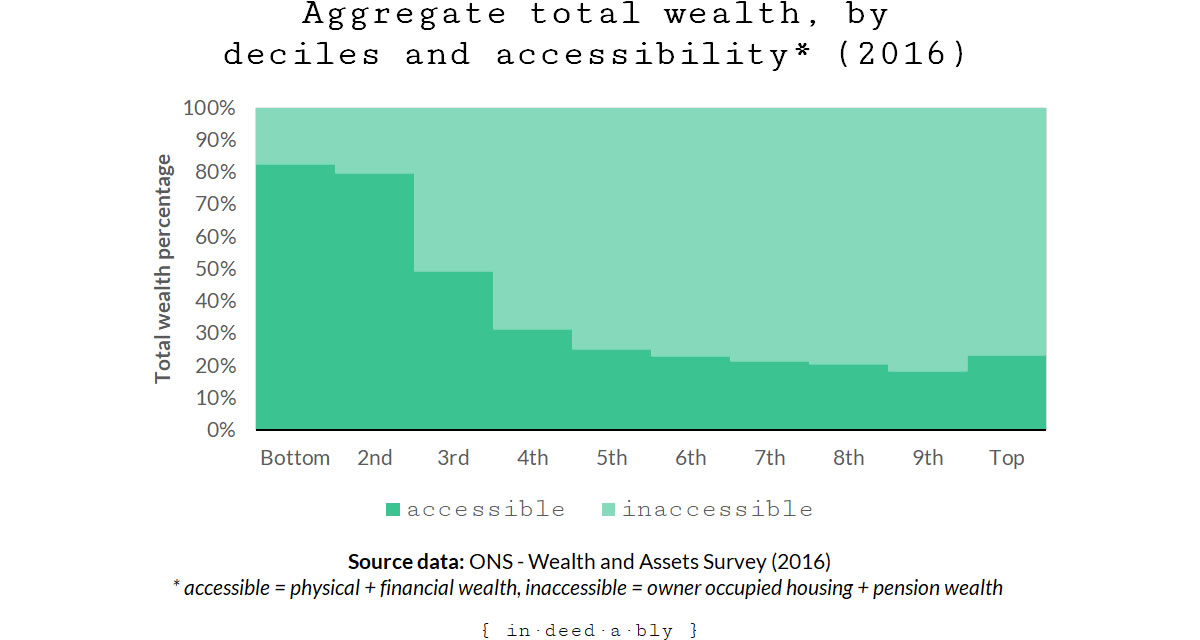
For the purposes of this chart I’ve ignore buy-to-let and second properties, as the available data doesn’t break these holdings down by household income decile.
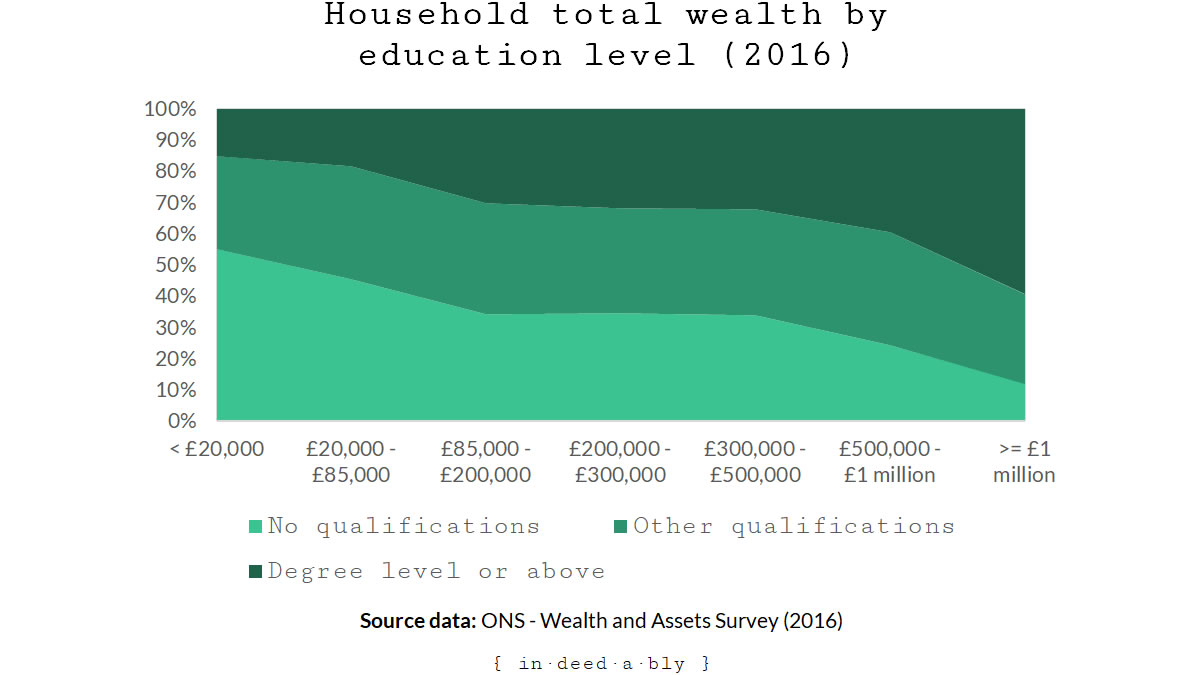
The statistical road to riches
Finally I looked briefly into some of the demographic aspects of household total wealth.
The education level breakdown makes a pretty compelling case for staying in school.
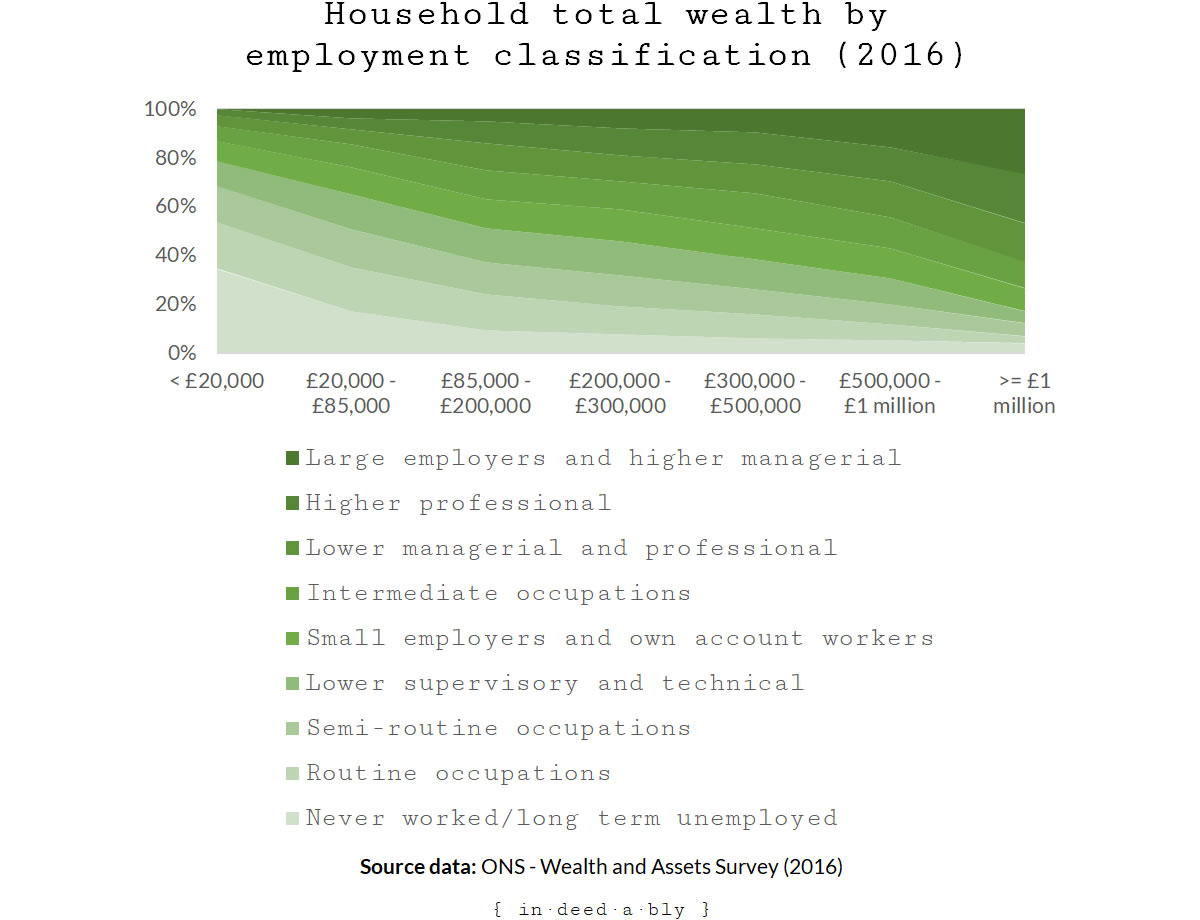
The employment classification breakdown highlights the positive outcomes investing in yourself can achieve.
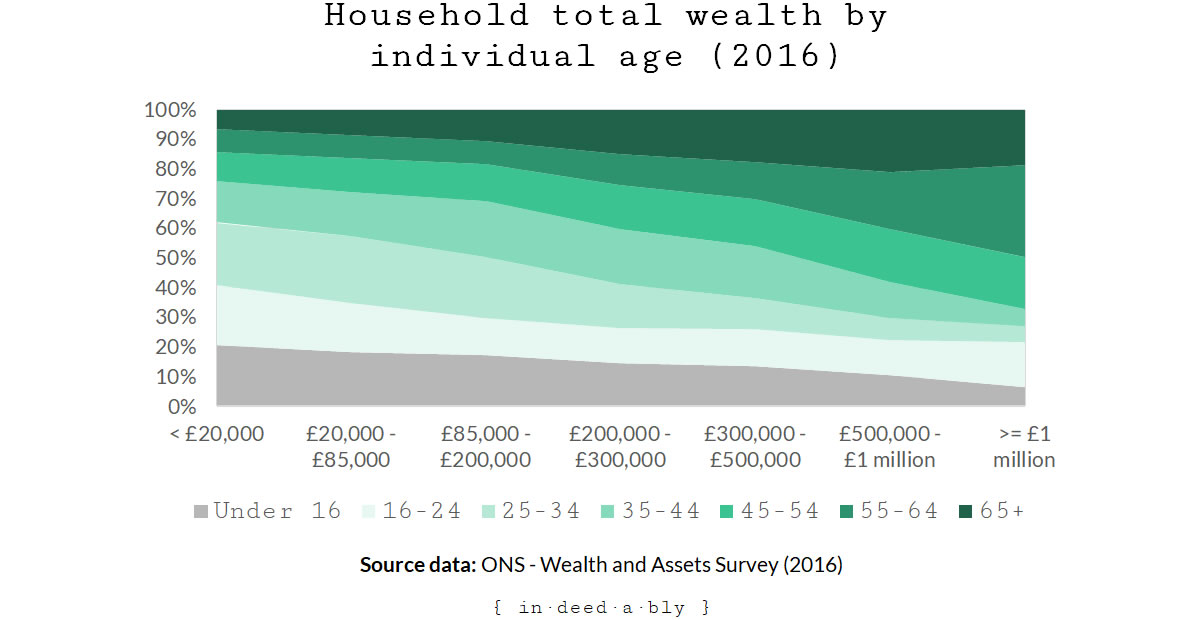
Finally the age breakdown demonstrates the power of compounding over time. Given the significant portion of total wealth that home ownership provides, this chart in part illustrates the impact of rising property prices on household wealth over the long term.
Asset rich, but cash poor
On reflection, I was surprised at how high the median household total wealth figure was.
The majority of the population have low savings rates. They earn some money, spend the bulk of it, and save very little.
So where did this wealth come from?
The total wealth figure can partially be explained by the high rates of home ownership. The United Kingdom property market has experienced strong long term price growth, increasing the wealth of homeowners.
Mandatory contributions to workplace pensions have a similar effect. Household total wealth increases, yet people can’t spend it because of the age restrictions associated with tax-advantaged pension accounts.
These factors combined contribute towards much of the population being asset “rich” but cash poor.
This helps explain many people’s behaviours. People act (and vote) based upon what they believe and how they feel. This can vary markedly from the facts!
The household wealth data appears to support the theory that capital growth makes you rich, yet it is cash flow that makes you feel rich.
capital growth makes you rich, yet it is cash flow that makes you feel rich
Household wealth that is locked away in home equity and pensions is difficult to spend on consumer items like holidays or new cars.
That constrains spending to (in most cases) what can be supported by income, making people feel like they are doing it tougher than their household wealth suggests is actually the case.
It isn’t so much that they can’t afford to do things, rather that they can’t afford to do them right now. A subtle difference, but an important one!
I find myself in a similar position, wanting a freshly baked cinnamon roll, yet not convinced I want to invest the time and effort required to make another batch to obtain one.
That does raise an interesting question for another time: is wealth generated as the result of increasing home values real or imagined?
References
- Bengen, W. (1994) ‘Determining withdrawal rates using historical data’, Journal of Financial Planning, vol. 7 no. 4
- HM Land Registry (2019), ‘House Price Statistics‘
- HM Land Registry (2016), ‘UK House Price Index (HPI) for September 2016‘
- Office of National Statistics (2017), ‘Family spending in the UK: financial year ending March 2016‘
- Office of National Statistics (2017), ‘Household disposable income and inequality in the UK: financial year ending 2016‘
- Office of National Statistics (2018), ‘Wealth in Great Britain Wave 5: 2014 to 2016‘
Featured by

DossersDiary.com 18 February 2019
When you look at the figures “through a FIRE movement lens” and conclude that decile ten has wealth exceeding 25 times expenditure (so is already “financially independent” by some people’s criteria), are you dividing decile ten wealth by expenditure for decile ten disposable income (and the same for the other deciles)?
If so, that’s a problem…… You’re dividing a figure for one group of households (decile ten wealth) by a figure for a possibly quite different group of households (decile ten income), which doesn’t give a meaningful measure of anything at all…..
{in·deed·a·bly} 18 February 2019 — Post author
That would indeed be a problem DosserDiary, were it the case.
Fortunately all income, expenditure and wealth figures discussed in this post use the “equivalised disposable income decile group“.
Whether that makes the conclusion meaningfully measurable or not is another matter!